Part:BBa_K3174007:Experience
This experience page is provided so that any user may enter their experience using this part.
Please enter
how you used this part and how it worked out.
Applications of BBa_K3174007
User Reviews
UNIQe068f8159ce34da5-partinfo-00000000-QINU
|
No review score entered. University of Texas at Austin iGEM 2019 |
Creating calibration strains for the University of Texas at Austins 2019 iGEM team projectThe 2019 UT Austin iGEM team [1] created a 'burden monitor' that used percent reduction in growth rate to quantify the metabolic burden of synthetic constructs from the iGEM kits. As part of the model, we had to create 'controls' that represented a diverse range of promoter and RBS strengths. These 5 promoter/RBS combinations were transformed into the burden strain of DH10B E.coli and used for this purpose. In order to visualize the growth rate of these parts, the 5 glycerol stocks were streaked out onto LB + CAM plates and grown in a 37 degree incubator for a period of 24 hours. Fig.1 below shows the results.
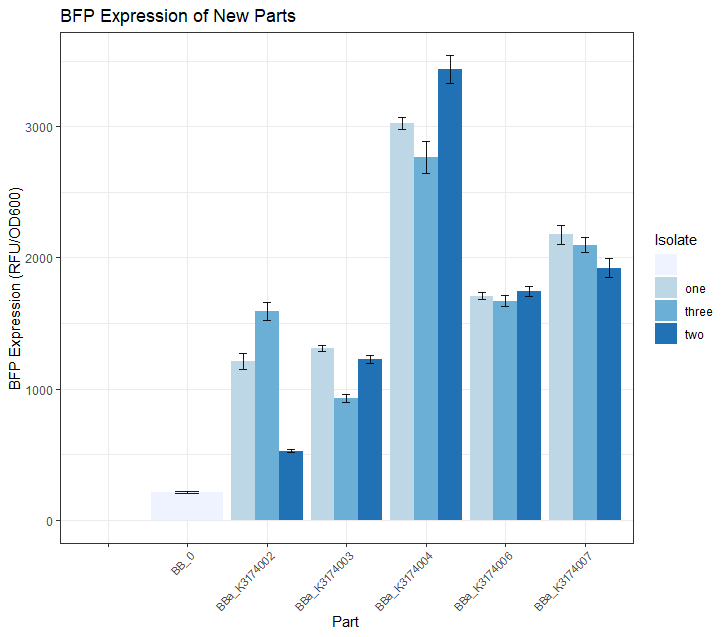
Once we had observed growth rates of each of these 5 parts, we wanted to see if the BFP expression levels matched our expectations based on what we know about the promoter strength of each part. We did this by selecting 3 colonies from each of these 5 plates and growing them in 5mL overnight LB + CAM cultures. We then placed 4 replicates of each isolate into a 96 -well plate (using 200uL of culture for each well) and took a single BFP measurement for each well. The resulting data is depicted in the Fig.2 bar plot below. We expected BBa_K3174002 and BBa_K3174003 to have the highest BFP expression levels because these parts have the strongest promoter/RBS combinations. Surprisingly, we found that they had the lowest level of BFP expression. We hypothesized that the cells with the intact genetic devices must have been under a high level of metabolic stress, resulting in loss-of-function mutations that contained a 'broken' genetic device (making these cells express lower levels of BFP). The new mutated cells, with their fitness advantage over the highly burdened intact cells, must have then quickly overtaken the population. We expected BBa_K3174004 to have a BFP expression level that was lower than BBa_K3174002 and BBa_K3174003 but higher than BBa_K3174006 and BBa_K3174007. However, it instead had the highest level of BFP expression out of all 5 parts. This is probably due to the fact that it had a strong enough promoter to cause BFP to be expressed strongly but a weak RBS that prevented considerable stress to the cell. It is important to note that although BBa_K3174004 expressed BFP at the highest level, it lacked consistency between each of the four replicates for each isolate. BBa_K3174006 and BBa_K3174007 expressed BFP as expected. They had the second and third highest BFP expression levels respectively. Both these parts have relatively weaker promoters that are unlikely to cause burden to the cell. They seemed to have the highest consistency between replicates.
These 5 constructs had their sequences confirmed via Sanger Sequencing. The major takeaways from this measurement data are:
|